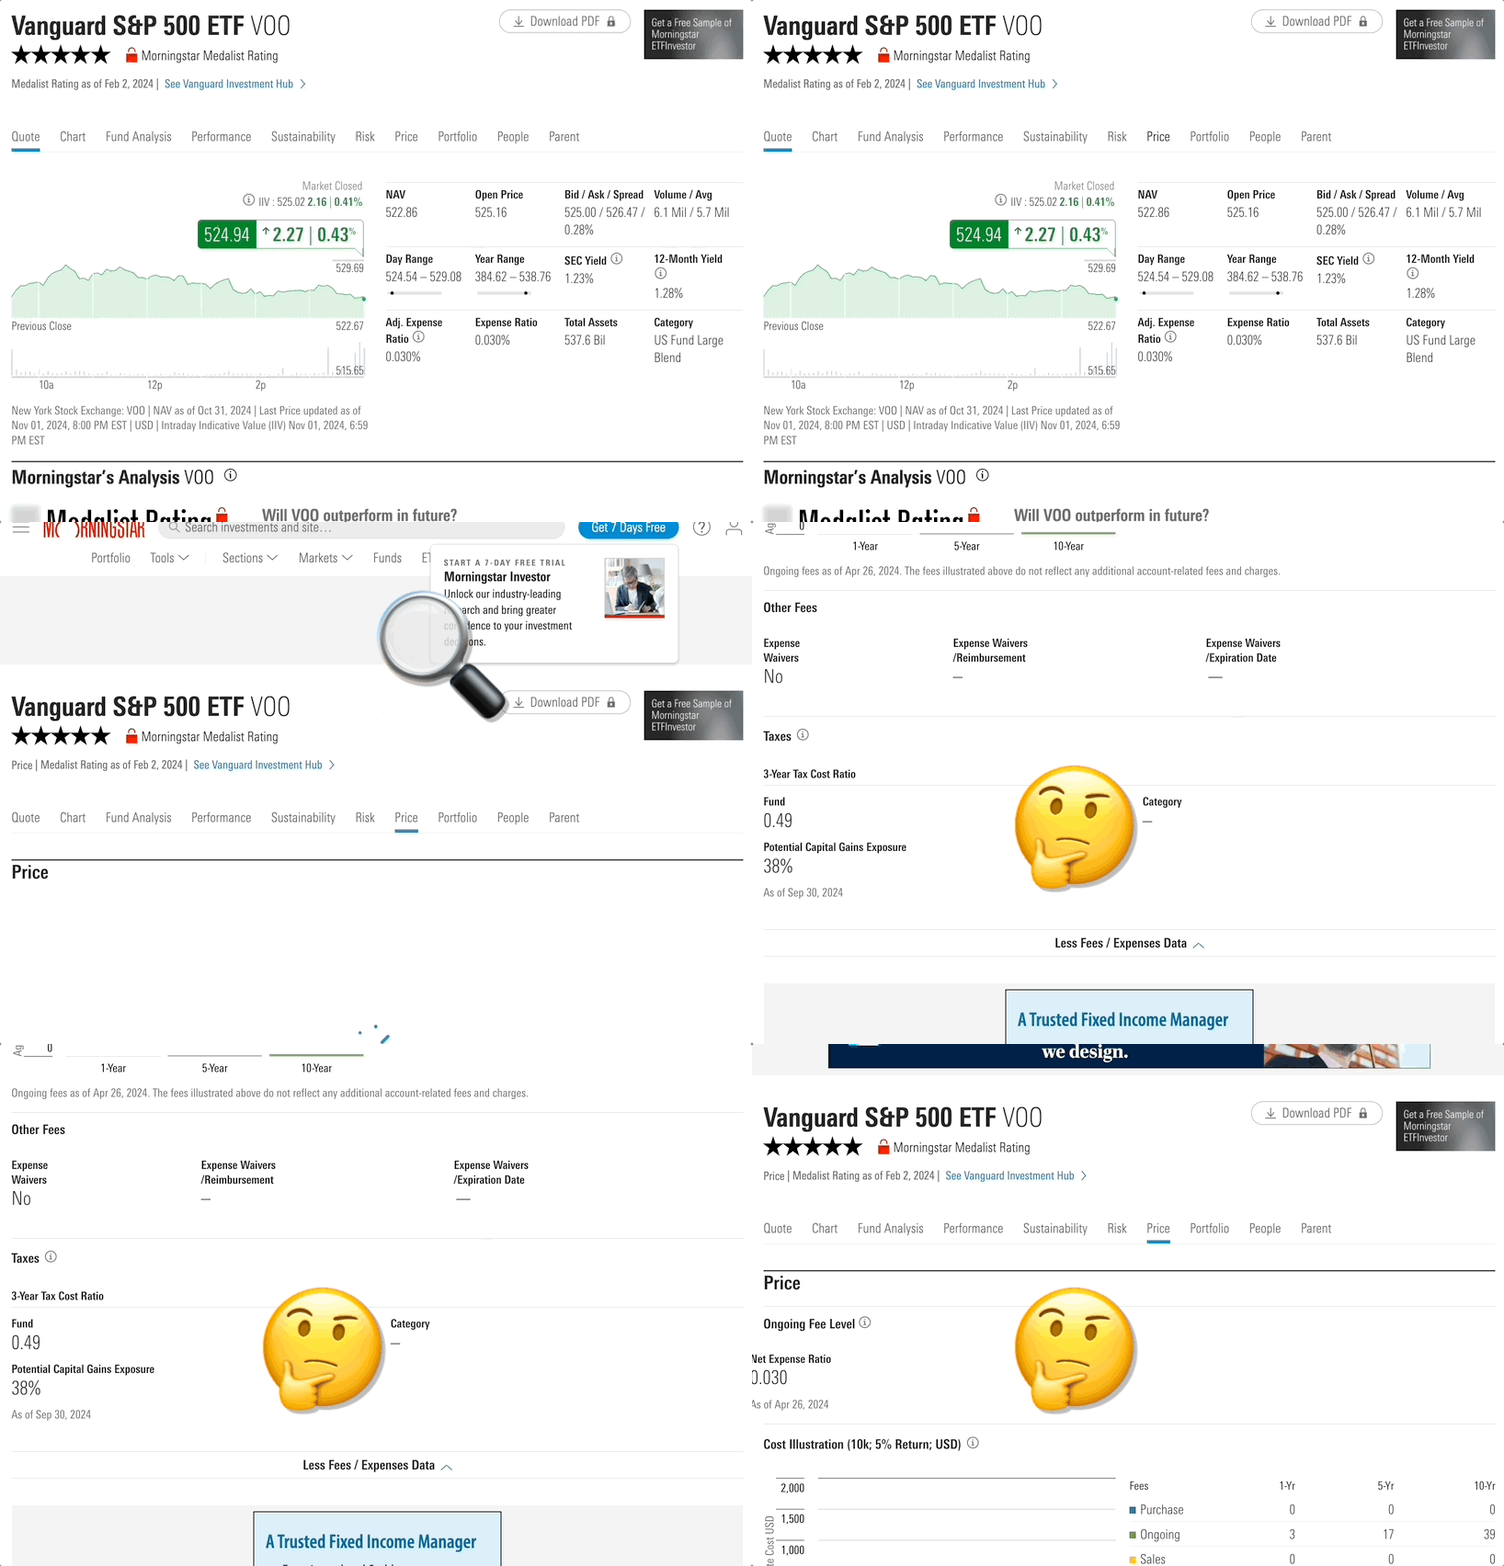
Why I Love/Hate Morningstar's Tax Cost Ratio
Tax Cost Ratio is invaluable for measuring an ETF's tax-efficiency. Morningstar should go further.
In early 2001, SEC issued a rule called Disclosure of Mutual Fund After-Tax Returns, aiming to help investors understand how tax impacts returns.
The rule noted that mutual fund distributions in 1999 resulted in over two percentage points of tax cost, which came as a “shock” to investors.
Although Morningstar had been publishing after-tax returns since 1993, less than a year after SEC published its rule, Morningstar adopted SEC’s guidance and published its After-Tax Return Methodology.
For a little while this was fine. Practitioners used the after-tax return to pre-tax return ratio to calculate a crude tax efficiency metric1. This was problematic, however, because loads and sales charges were entangled with tax.
To disentangle loads and tax, Morningstar introduced Tax Cost Ratio and published its methodology in early 2005.
What is Morningstar’s Tax Cost Ratio?
Tax Cost Ratio “measures how much a fund’s annualized return is reduced by the taxes investors pay on distributions.”
It looks a lot like expense ratio and “is usually concentrated in the range of 0-5%. 0% indicates that the fund had no taxable distributions and 5% indicates that the fund was less tax efficient.”
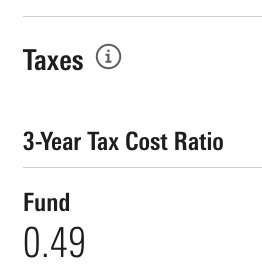
For example, Vanguard S&P 500 ETF (VOO) has a 3-Year Tax Cost Ratio of 0.49%, which means shareholders paid roughly 0.49% of their investment in tax on average each yeah over the previous three years.
The crucial word to keep in mind is “distributions.” Tax Cost Ratio is built on Morningstar’s pre-liquidation after-tax return, and does not consider the eventual capital gains tax investors pay when closing/liquidating a position. More on this later.
Tax Cost Ratio is conceptually simple: Morningstar subtracts the relevant tax from each of a fund’s distributions, reinvests the post-tax proceeds, and calculates the return (which is now after-tax). It then compares after-tax return to pre-tax return.
Computing Tax Cost Ratio is harder.
A fund receives distributions with different tax characters: Ordinary income, short-term capital gains, long-term capital gains, return of capital, and more. Morningstar has to apply the prevailing federal tax rates and the correct historical tax rates (per SEC’s guidance) to calculate Tax Cost Ratio for, say, the trailing 5-years.
That’s still not too bad. Aggregating the fund distribution data is the real lift.
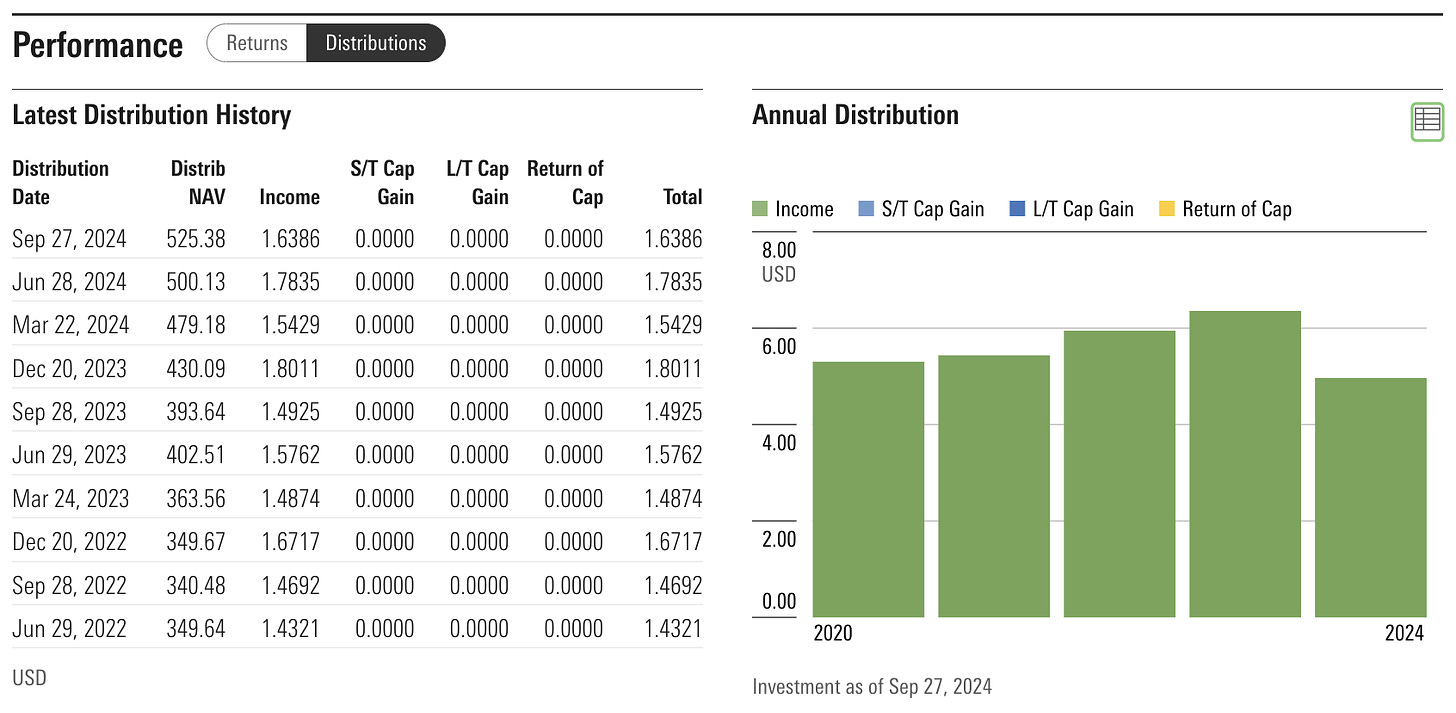
The data are not perfect. The “Income” column includes interest income (taxable at ordinary income rates) and qualified dividend income (taxable at preferential long-term capital gains rates). Morningstar solves this by assuming dividends are not qualified unless the fund company tells them otherwise.
Anyway. The point is that Morningstar does the hard work of literally codifying SEC’s guidance, transforming it into a conceptual framework that isolates the impact of tax, retrieving the data, and crunching the numbers.
This is important work.
Morningstar’s Tax Cost Ratio is invaluable
I look at Morningstar's Tax Cost Ratio every day.
Increasingly, I use it to find tax cost outliers worth a closer look.
One example is iShares MSCI Russia ETF (ERUS), which shows a year-to-date Tax Cost Ratio of 35.01%. Recall that Morningstar’s methodology paper says that most funds have a Tax Cost Ratio of 0%-5%.
A 35.01% Tax Cost Ratio is bizarre
But a quick look at the product page confirms the fund is liquidating and certainly realizing tax along the way.
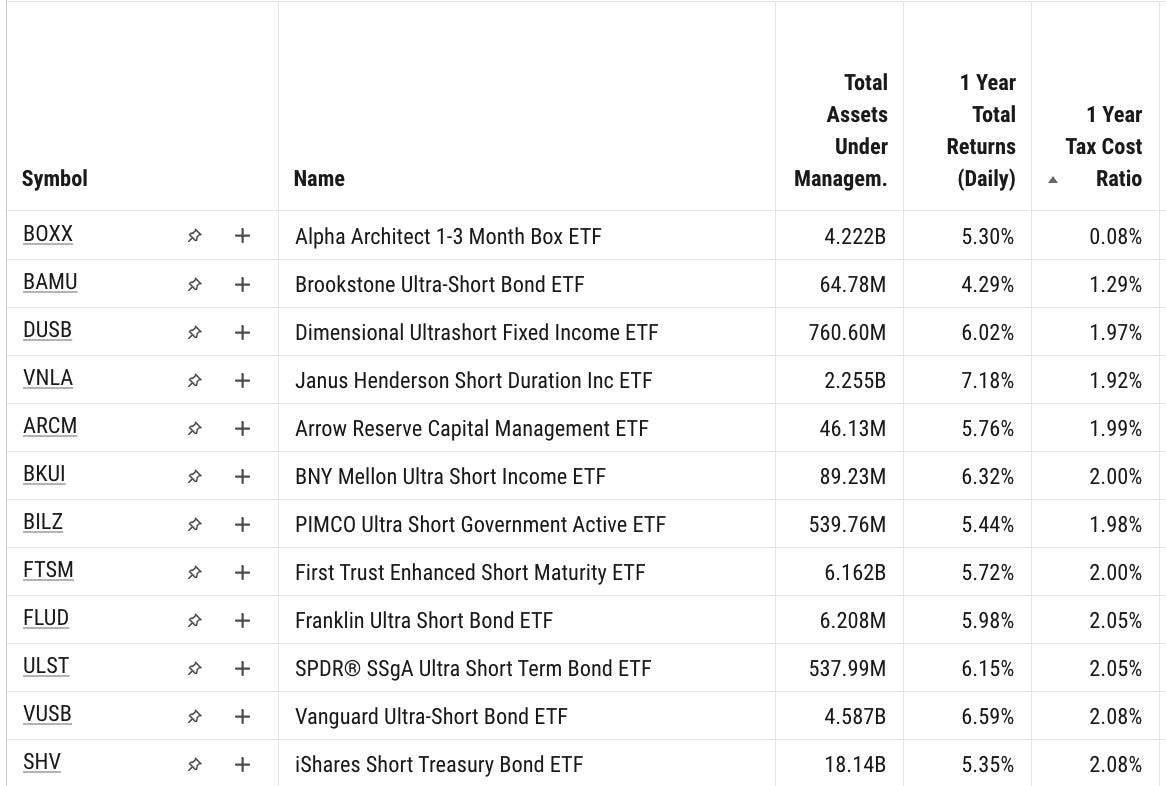
Another example is the ultrashort bond category.
Whatever you think of BOXX, its 1-Year Tax Cost Ratio is two orders of magnitude lower than its peers.
Its Tax Cost Ratio is such an outlier that it looks wrong. Is BOXX miscategorized? Is it shifting risk around? What is the catch? That’s a topic for another time (an ongoing investigation), but Tax Cost Ratio makes it easy to understand something interesting is happening.
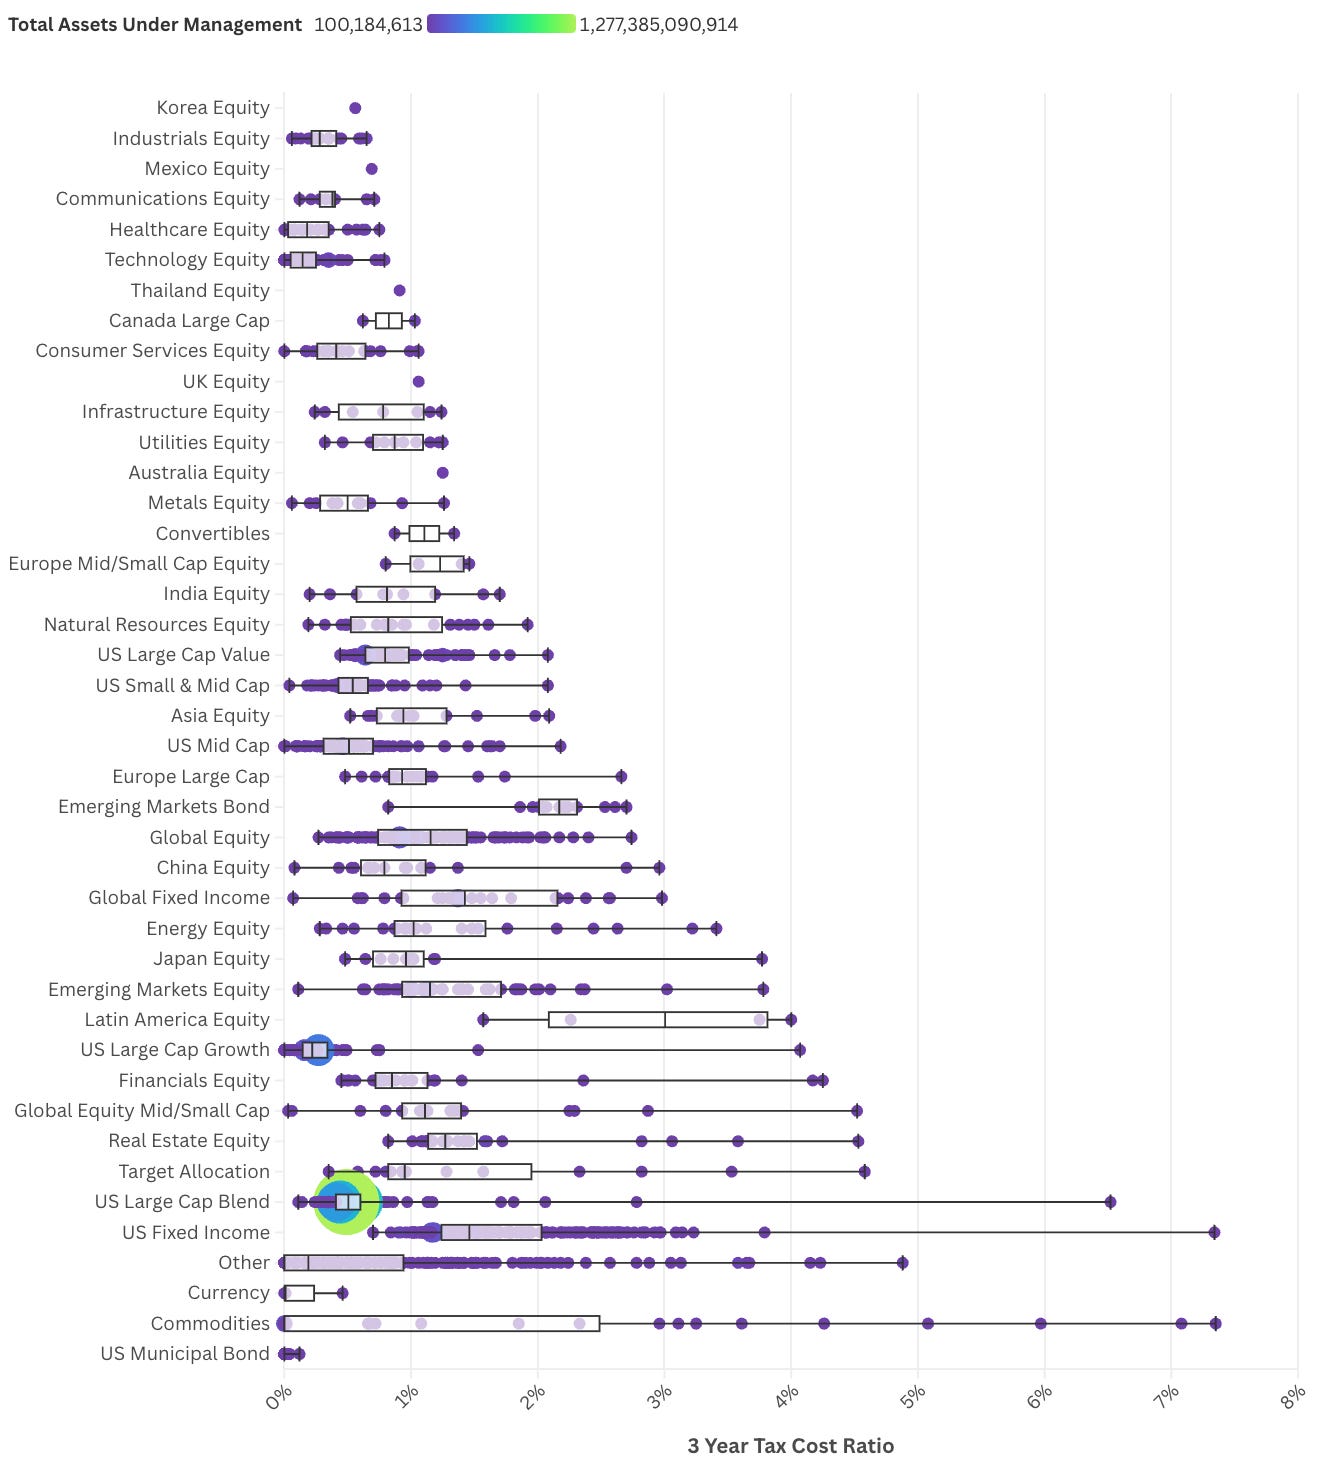
I also like comparing across categories to get a sense of relative tax efficiency and dispersion.
Admittedly, this chart raises more questions than it addresses (ETF categorization is problematic), but some interesting themes emerge. For example, municipal bonds have zero Tax Cost Ratio. What’s going on here?
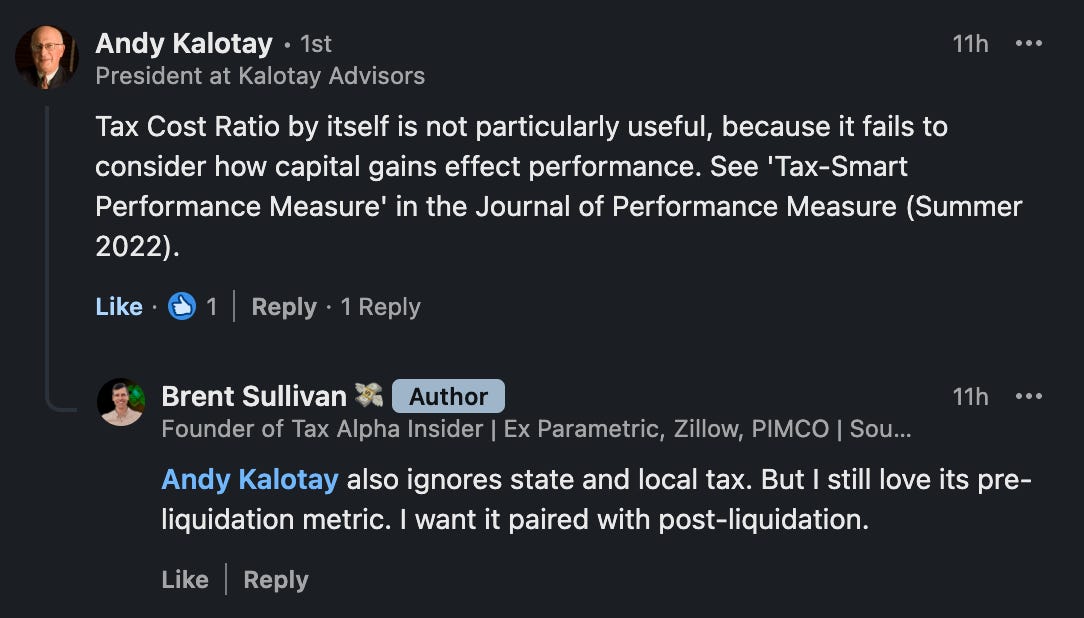
Many municipal bonds generate federal-exempt interest income. But if the interest is taxable at the state level (for example, out-of-state interest), Tax Cost Ratio will not capture it because Morningstar ignores state and local tax (per SEC guidance).
If we look at Morningstar’s after-tax return assumptions more closely (since it powers Tax Cost Ratio), more cases emerge where Tax Cost Ratio over or underestimates an investor’s actual experience.
Tax Cost Ratio Doesn’t Go Far Enough
SEC’s assumptions simplify the world. Although I haven’t quantified the magnitude of the inaccuracy (yet), here is a list of SEC calculation assumptions (which Morningstar adopted) I wish Morningstar’s Tax Cost Ratio reflected.
Assumption #1: Apply the maximum federal income and capital gains tax rates
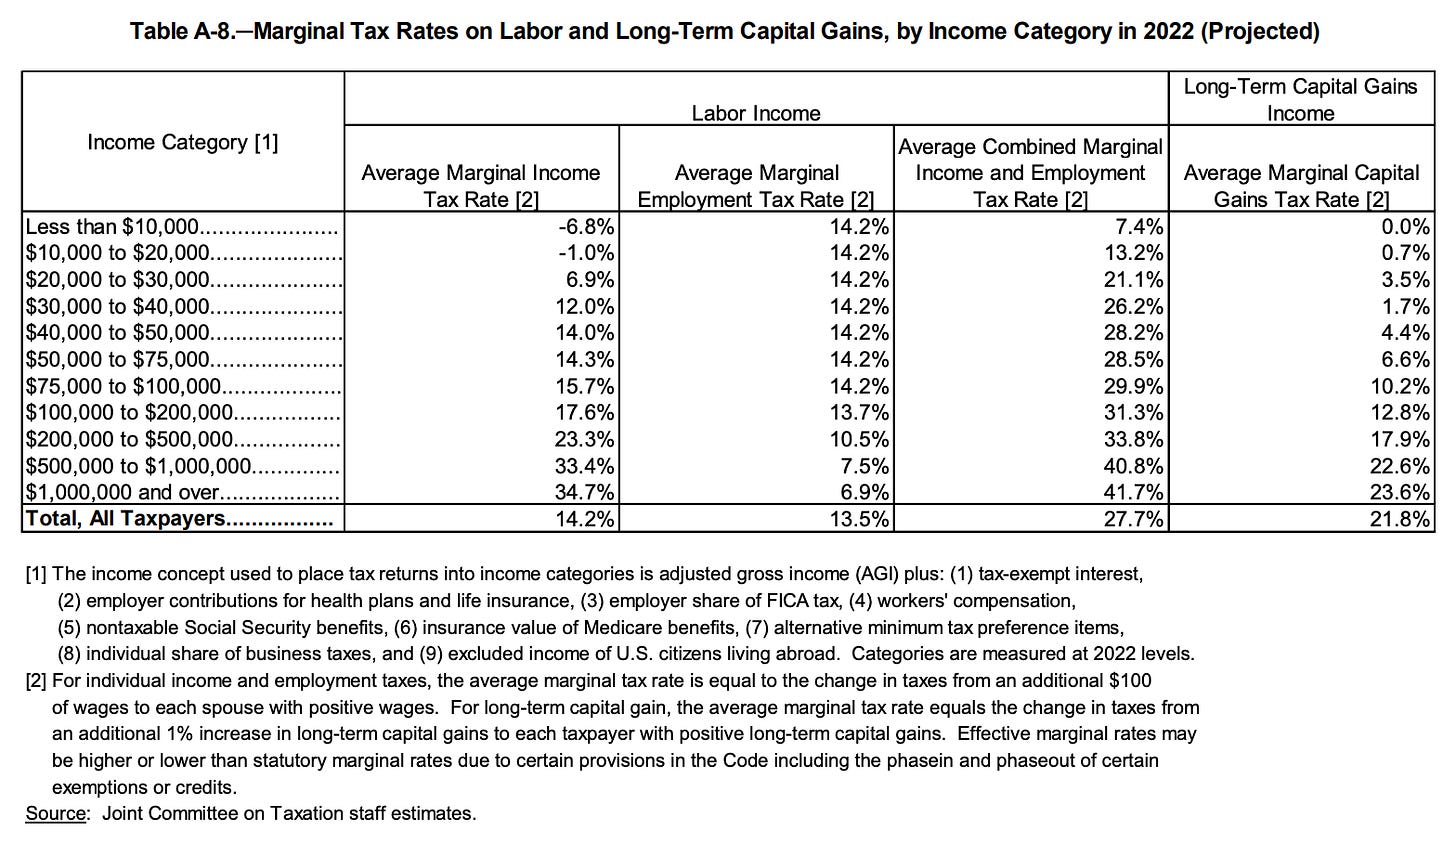
Consequence: Tax Cost Ratio likely overstates tax cost (see Joint Committee on Taxation data showing most people don't pay the highest marginal rates).
Assumption #2: Ignore Net Investment Income Tax (and other personal circumstances)
Consequence: Tax Cost Ratio understates tax burden for those responsible for NIIT. We could say the same about alternative minimum tax (AMT).
Assumption #3: Ignore state and local tax
Consequence: Tax Cost Ratio understates tax cost for investors with state and local tax burdens.
Example: National municipal bond ETFs may cause state and local tax burden from out-of-state interest depending on an investor’s state of residence.
Assumption #4: Use pre-liquidation after-tax return
Consequence: Ignores adjustments to cost basis, which may impact eventual tax due.
I alluded to this early in this piece, but Tax Cost Ratio depends on pre-liquidation after-tax return, which doesn’t consider the eventual tax an investor pays when closing the fund position. To make the concept concrete, pre-liquidation after-tax return mostly corresponds to IRS form 1099-DIV, which records the amount and character of distributions and which investors receive every year a fund pays distributions.
When investors eventually close a position, they receive IRS form 1099-B, which tells them about the capital gain or loss they realized. To accurately capture these taxes too, Morningstar would need to produce a post-liquidation Tax Cost Ratio.
Quick aside: the pre-liquidation/1099-DIV and post-liquidation/1099-B analogy is not tax advice. It’s an educational illustration that hopefully makes the idea stick. And there are some exceptions when ETFs produce K-1s, but let’s not worry about that stuff for now.
This is especially relevant when a fund’s cost basis is adjusted. In particular, ETFs distributing return-of-capital force investors to lower their cost basis, increasing tax liability at liquidation. I’m thinking of all those covered call ETFs that return capital as standard operating procedure.
When funds retain undistributed capital gains, investors owe tax and increase cost basis. This is rare, but it happens.
Post-liquidation Tax Cost Ratio would be a great complementary metric to ship along with Tax Cost Ratio.
Calculator
Each assumption above depends on investor circumstances. A calculator that receives user input (including relevant tax rates and liquidation date) and produces relevant results rather than static data would be helpful. Investors and advisors likely have spreadsheets doing this work already. Morningstar may as well do it for them.
Beyond my request for a calculator, I have two additional requests:
Tax Cost Ratio should be available as soon as one month following launch. Although after-tax returns are available after one month, I haven’t seen a 1-month Tax Cost Ratio. If I’m mistaken on this, someone please correct me.
I would like to tease apart Tax Cost Ratio and see its drivers, including a tax character breakdown. I call this the “tax story” of the fund, and sometimes it takes a lot of work to unwind.
Morningstar Doesn’t Go Far Enough
Tax Cost Ratio doesn’t seem like a serious effort at Morningstar. Maybe I’m wrong.
For one, the Tax Cost Ratio paper is nearly 20 years old.
For another, Morningstar’s recent article “What Is the Total Cost of Owning an ETF?” doesn’t mention it.
Moreover, although Tax Cost Ratio is available in Morningstar Direct, the publicly available metric on morningstar.com is hard to find.
In many cases, investors pay far more in tax than portfolio expenses (this is an in-progress research project, but take my word for it for now), and surfacing tax as a relevant cost is worthwhile.
To be clear, I think Tax Cost Ratio should be presented right next to expense ratio
Before SEC’s 2001 final rule, many vendors produced after-tax metrics or calculators to assist investors (see note 10). Morningstar could provide similar tooling as the next evolution of Tax Cost Ratio.
I wish they would.
p.s. Interested in writing for Tax Alpha Insider? I’m looking for collaborators who want to amplify their tax-conscious work. Send me a message.
Gordon, R. N., & Rosen, J. M. (2001). Wall Street secrets for tax-efficient investing: From tax pain to investment gain (p. 85). McGraw-Hill.


